Business Charts enables users to create a chart from a SharePoint list or other data source. When creating a chart, grouping and aggregation are very useful to sort, summarize and illustrate the business data.
Business Charts supports grouping data by one column, which means that Business Charts can group data in as many series as you need and visualize the groups properly on the chart. After selecting one column for grouping, you can apply one of the supported aggregation functions to summarize the data on the chart.
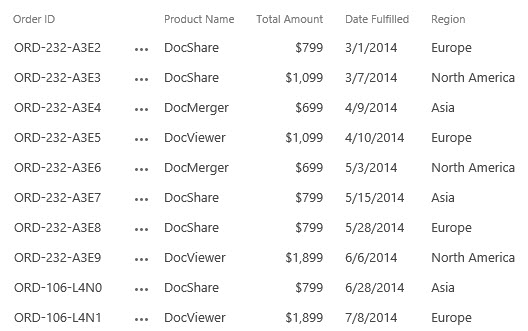
Consider the following data for each product consumption in three regions for year 2014.
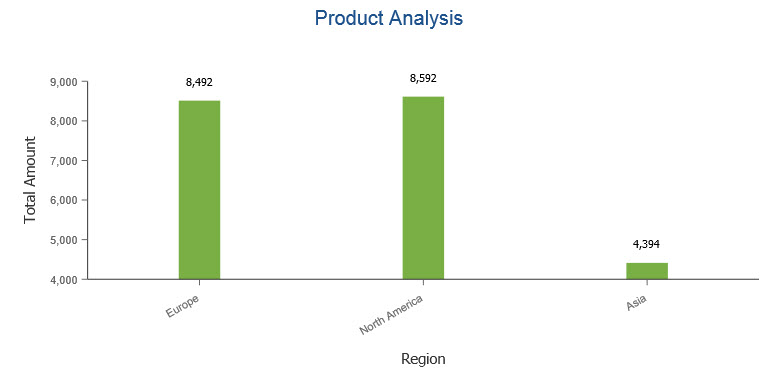
Assume you want to create a chart to analyze the total sales for each region. You can group the sales data using the “Region” column.
But only grouping is not enough, you also need to apply aggregate functions like Sum to “Total Amount” column to calculate the total sales for each region.
And then, the data will be visualized as follows.
Grouping Data based on Interval
You can group the data by a Date and Time field. This is very useful when you want to group and compare the data changes by periods, such as year-by-year.
Business Charts provides the predefined interval to group data via a Date and Time field. So, the chart can group data and display the data series on the chart.
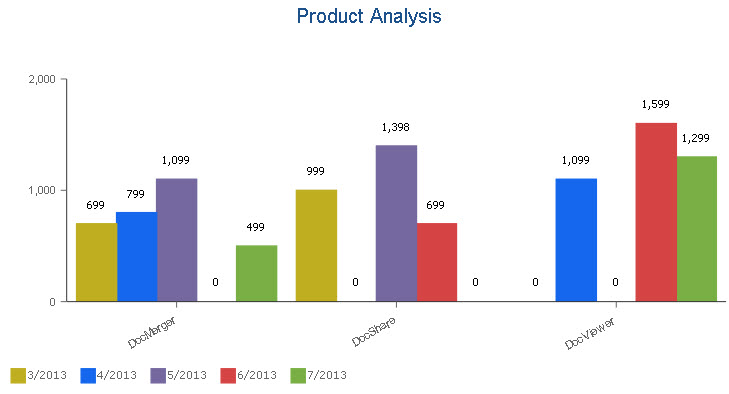
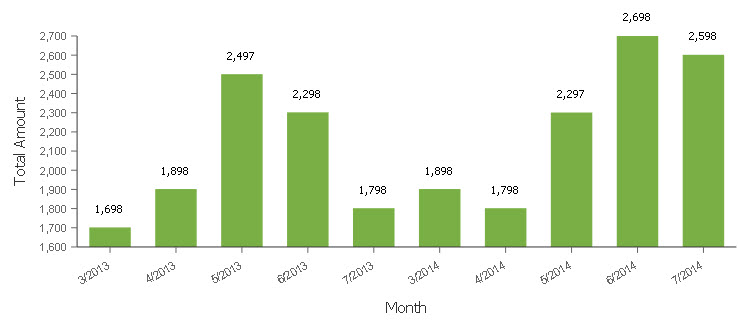
Assume you want the chart compares each product sales data by month, you can set the interval as “Month”, and then the chart is as follows.
Even better, when you create a chart from a list that use dates, and the dates are plotted on the category axis in the chart, Business Charts can displays the category axis as a date axis, same as Microsoft Office Excel.
The date axis displays the dates based on intervals by hour, day, week, month, quarter, or even year.
So if you want the chart illustrates the sales data by quarter, you can set the interval as “Quarter” for category axis, and then the chart is as follows:
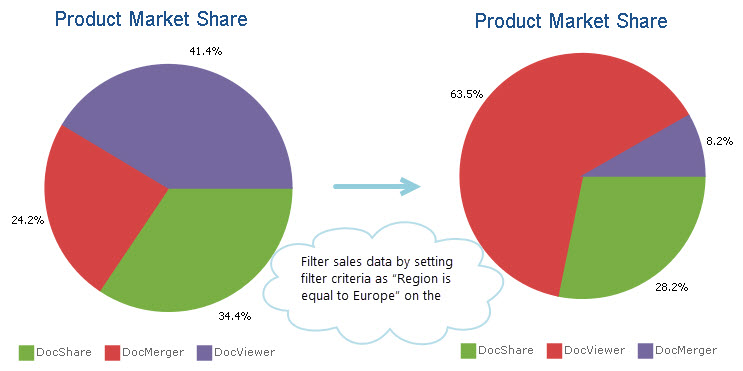
By creating a filter on the Business Charts Web Part, you can create a dynamic chart by filtered data.
For example, a chart is created to visualize the product market share. Without creating a new chart, you can create a filter on the chart to only show the product market share in the Europe region.